MODEL PORTFOLIOS
This page will be updated on a bi-monthly basis. The latest data typically is always at least three days old, due to the forward pricing of its funds.
The portfolio management approach is both strategic as well as tactical. The decisions are pro-active, rather then reactive, which means, when markets turn we are more likely taking preemptive measures rather than waiting for technical and/or fundamental research to provide the conventional signals confirming a down- or upward-trend.
Next Update: after 30 September 2016

This is also the reason why the so-called "NEW HIGHS in the S&P 500" etc. don't really show up in the US equity fund performance. Few fund managers and even fewer media presenters really mention this conundrum for foreign investors, even though it is a major distortion of the "bottom line". And - so I think - a distortion of the technical data. But with the US as the main equity investor in the world, it is a risk many think they have to live with.
From that list we can see that volatility was well above average, but not the same in every region. That offers a chance for "market timers" like us. You would also need to establish, which of the regions performs best, relatively speaking so as to adopt the right allocation, i.e. greater for Europe, and 0% before the BREXIT. Asia was much less affected by the BREXIT, which is logical. Here too, extra earnings could be earned since February.
What we did not do was to use all available funds when taking on risk. Most of the time it was less than 50%. To produce positive returns of 15% is no mean feat in this environment, well considering that we only suffered ONE drawdown of 4% in February, - none during the BREXIT debacle.
latest update: August 8, 2016 for end of July 2016
THE NEW MODEL
As of January 2016, I have set up a new model. The previous models, based on 4 different risk strategies, had become outdated, with major funds being discontinued etc. I also changed data providers.
PLEASE NOTE, THIS IS A REAL PORTFOLIO, WITH PLATFORM FEES AND FUND FEES BEING LEVIED ON THE PORTFOLIO. SWITCHING IS DONE IN REALTIME, NO VIRTUAL ENHANCEMENT OR SHORTCUTS. THUS I EXPECT YOU SHOULD ARRIVE AT THE SAME RETURNS AS THIS MODEL, IF YOU FOLLOW THE PARAMETERS AND INSTRUCTIONS STRICTLY.
The New Parameters
The new model portfolio is based on a single risk profile:
Growth
- to return 12% per annum (calendar year)
- to limit the maximum drawdown to -8% (peak to trough in calendar year)
- maximum exposure to equity at 90%, no minimum
- maximum cash holding 100%
- all data is provided in Singapore Dollars.
The portfolio management approach is both strategic as well as tactical. The decisions are pro-active, rather then reactive, which means, when markets turn we are more likely taking preemptive measures rather than waiting for technical and/or fundamental research to provide the conventional signals confirming a down- or upward-trend.
Next Update: after 30 September 2016
Model Portfolio as per End of July 2016
Portfolio performance YTD: +15%
We have now seen 13 changes year-to-date. The first 6 are a repeat of the update from April 2016. Those switches were basically gradual build-ups and stepped exits, reflecting the market momentum in the assets and regions we looked at.
We had long switched to safety (cash and bond funds) in December 2015, avoiding the downtrend in January. And so:
- the mid-January low presented a first opportunity to rebuild our equity positions.
- ...switched 60% of portfolio into equity on January 22 in anticipation of a rebound. That rebound came, but was quickly reversed in February. The portfolio suffered a drawdown of -4% over the first 10 days of February. THIS WAS THE ONLY >-1% DRAWDOWN, THE PORTFOLIO SUFFERED YTD. Our extra allocation into European and US equity helped bring the portfolio back to peak January levels (+2.5%) as early as March 1, unlike the global equity fund, which had not even recovered the early February losses.
- March 3, we sold off the first 10% of equity, banking profits in Europe.
- March 11, we reduced equities by another 16%, selling all holdings in Europe, and reduce allocation to global equity funds, but holding onto US and Asian equity funds.
- March 23, we sold of the remaining holdings in the US, reducing our overall equity exposure to just 16% with an extra 4% in a commodity fund, keeping valuations steady. Against that the global equity fund declined -4% from March 1 to April 5.
- March 29, all remaining equity holdings were sold, and we bought 20% gold funds instead. As a result, the model valuations continued to rise, especially from April 26 to May 10, in contrast to global equities, which fell sharply again.
This update covers the period between January 1, 2016 to end of July 2016.

First Obvious Observation:
- The model outpaces all funds we chose to compare with.
- Staying with single management style, or investment approach of an individual fund only created higher volatility but no extra performance.
- Traditional risk management (in a single fund) did little to alleviate the volatility. When it did, performance suffered.
- Working on consensus assumptions, like the prospective BREXIT result for example, did not help performance either.
Applied Investment Principles:
Using Asset Allocation, and timely Asset Rotation, the model now outperforms most major country and regional indices. In addition, I applied a global bond strategy, which performed exceedingly well, something I had anticipated in the current investment climate. I also actively rotated in and out of gold and precious metal funds, including some allocation into global resources. This created the extra uplift when equity markets turned down. See scenarios of the switches 7, 10 & 12.Fund comparison and Analysis
The funds we compare the portfolio against are longstanding retail funds, sold in Singapore and based on SGD. This is one of the aspects why the US fund returns do not reflect the US index performances: The USD has lost considerable value versus the SIngapore dollar. Indeed from the peak on January 11 (1.44) to the low on August 3 (1.34), the USD lost almost 7% versus the SGD. |
| Source: Yahoo Finance; USD vs SGD. Peak to trough in 2016. |
This is also the reason why the so-called "NEW HIGHS in the S&P 500" etc. don't really show up in the US equity fund performance. Few fund managers and even fewer media presenters really mention this conundrum for foreign investors, even though it is a major distortion of the "bottom line". And - so I think - a distortion of the technical data. But with the US as the main equity investor in the world, it is a risk many think they have to live with.
Only 2 funds are showing some positive return, about 2.5%, the rest are in the red, including US equity funds. Singapore investors with negative performance since August last year must remember that there were several serious drawdowns in equities - and in commodities. In 2016, we do battle against massive volatility in many asset classes:
- maximum drawdown and rebound in local currency, January peak to February low
- maximum drawdown and rebound in local currency, in response to BREXIT, June 24
NASDAQ 100: 1. -17%, rebound to April +15% 2. -6.5%;
S&P500: 1. -10%, rebound to April +14% 2. -6%;
DAX: 1. -20%, rebound to April +20% 2. -11%;
FTSE 100: 1. -12.5% (- 10% for GBP) rebound to April +16.8%; 2. -9%;
HANG SENG: 1. -15%, rebound to April +13% 2. -3%;
NIKKEI 225: 1. -22%, rebound to April +13% 2. <-2%;
STI: 1. -12.5%, rebound to April +16.4% 2. -3.8%
ASX: 1. -11%, rebound to April +15.5% 2. -4.8%
From that list we can see that volatility was well above average, but not the same in every region. That offers a chance for "market timers" like us. You would also need to establish, which of the regions performs best, relatively speaking so as to adopt the right allocation, i.e. greater for Europe, and 0% before the BREXIT. Asia was much less affected by the BREXIT, which is logical. Here too, extra earnings could be earned since February.
What we did not do was to use all available funds when taking on risk. Most of the time it was less than 50%. To produce positive returns of 15% is no mean feat in this environment, well considering that we only suffered ONE drawdown of 4% in February, - none during the BREXIT debacle.
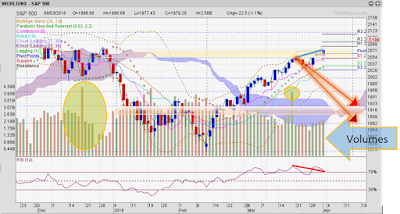
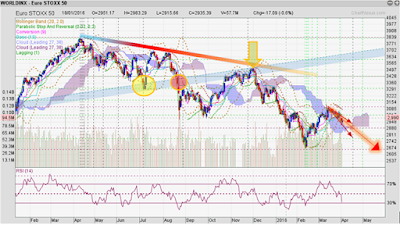
The briefest of outlooks for the next 2 months:
I continue to advocate caution rather than an increase in equity. In the very short term, more uncharacteristically sharp up and down should be expected. To attempt to trade requires exceptional tools and exceptional good operational systems. We work with simple, plain vanilla retail funds.
We might see a new high forming going into early September, but we believe it to be short-lived. A longer term opportunity now might be purchasing precious metals and at some point soon other commodities like oil. The most volatile of assets however continue to be currencies. Hoping for the best
RK, August 8, 2016
Previous Updates
Model Portfolio Update as per End of May 2016
This update covers the period between January 1, 2016 to end of May 2016.

- The global equity fund declined -17%.
- The maximum drawdown in the global balanced fund was <4%, remaining below the starting level during the period.
- ... switched to safety (cash and bond funds) early in December 2015, so no negative figures for January.
- ...switched 60% of portfolio into equity on January 22 in anticipation of a rebound. That rebound came, but was quickly reversed in February. The portfolio suffered a drawdown of -4% over the first 10 days of February. Our extra allocation into European and US equity helped bring the portfolio back to peak January levels (+2.5%) as early as March 1, unlike the global equity fund, which had not even recovered the early February losses.
- March 3, we sold off the first 10% of equity, banking profits in Europe.
- March 11, we reduced equities by another 16%, selling all holdings in Europe, and reduce allocation to global equity funds, but holding onto US and Asian equity funds.
- March 23, we sold of the remaining holdings in the US, reducing our overall equity exposure to just 16% with an extra 4% in a commodity fund, keeping valuations steady. Against that the global equity fund declined -4% from March 1 to April 5.
- March 29, all remaining equity holdings were sold, and we bought 20% gold funds instead. As a result, the model valuations continued to rise, especially from April 26 to May 10, in contrast to global equities, which fell sharply again.
I can tell you now that in the model we have rebuild some equity holdings, but only about 50%. Where we have increased allocation substantially is in gold funds, which are now 30% of portfolio!
Our old models were "abandoned" in mid-2012. In reality, we kept portfolios running at pace, but chose to provide insight to our work only to existing investors.
Still it is worth scrutinising as our active approach resulted in significant outperformance of markets and comparative funds.


THE OLD MODELS
Our old models were "abandoned" in mid-2012. In reality, we kept portfolios running at pace, but chose to provide insight to our work only to existing investors.
Still it is worth scrutinising as our active approach resulted in significant outperformance of markets and comparative funds.
The fat lines are our portfolios, the narrow lines are benchmarks and indices.
PortA, PortB, PortC and PortD are actively managed; PortE is semiactively managed, i.e. every 3-6 months or on a larger, longer term change in trend.

Update (15-6-2012)
Once again portfolio valuations show up the hallmarks of our investment strategy. This is a view from November 2011 till mid June 2012. Our strategy was to stay with the markets till March and then take profit, reducing equity holdings by 50%. Sensing more sinister investment conditions ahead in May (see dip in the markets), we sold of all remaining equities as soon as markets had bounced back a little. Thereafter, we recommended cash and bonds only. We remain cautiously positioned but are on the lookout for a change in investment conditions.
Over just these 8 months, the models A-D outperformed the market, taking profit at the most appropriate time and thereby opening up a margin of almost 10% as of 15-6-12.
Since inception in October 2009, Model D (highest risk) outpaces the MSCI World by more than 20%. On a different note: please observe Model (PORT) E, the purple broken line. This model is meant to follow the markets with the added benefit of being less volatile. It only rebalances once or twice a year. You can see that over this reporting period, it does do what it is designed for, 'good enough' for long term investors you might argue.
Here the 18-month chart that simply confirms our statement above:
 |
| model portfolios compared with market benchmarks Nov'11 - Jun '12 |
Previous updates:
UPDATE end of February 2012

For the participant, it needs little explanation! For those not so familiar with it, here is some background.
April 2010
Our
first 'coup' was to recognise the dangers in April 2010, saving
portfolios some 15% drop. Thereafter we could take it easy: our
re-entries were highly successful (stepped entries).
September 2010
The
exit in September 2010 may look tepid. The MSCI World kept rising till
February 2011, so did the Asian indices, but to a much lesser degree.
And yet, at the same time the Singapore Dollar also rose to 1.20 against
the USD. Safety therefore may not have produces a firework of returns
but having secured a nice margin against benchmark funds and the MSCI
Asia ex Japan, we slept rather peacefully.
November 2010
We
attempted an equity engagement after a correction in November, but our
still heavy focus (65%) on Asian equity did not produce significant
gains.
We exited in
January 2011
Stocks fell hard into February thereafter. We reengaged in the last week of February.
March 2011
March
brought the Japan disaster - and portfolios benefited from the drop -
and subsequent rise of stock markets: we had identified trends that not
only stayed the course during the crisis but accelerated from there,
outperforming markets decisively.
May to August 2011
A
hectic time followed as the writing was on the proverbial wall for a
decisive correction. We tried twice to re-enter after an April exit, but
none of these really made any headway. The correction started in
earnest August 4th, we were out (all equity to cash) on August 5th,
arguably another outstanding exit time, considering the subsequent drop
of more than 25% in global markets.
November 2011
We
took our 'own sweet time' before reengaging. After the final thud on
October 3rd, I advocated a stepped approach to reenter markets, in
almost identical steps of 35%, bringing exposure back to their highest
levels by December. The result is plain to see: we used the volatility
to buy into the markets and kept increasing the equity alloation while
the positive margins to global market indicators expanded further.
February 2012
By the end of February, mirroring the models, our actual client portfolios had recaptured and in several cases exceeded previous highs leaving every benchmark trailing, by as much as 35%.
NOW!
This
resounding result is not just astounding, it also provides the best
reason NOT to rush into a risky market unless we are 100% sure it will
bring positive results, - like the most recent period between November
and now. How to assess that correctly is - key. It takes courage and conviction to achieve it.
Right
now, we are rather on edge and prepared to exit markets if market
sentiments show signs of significant deterioration. At the moment, such
a change is more likely the result of unforeseen circumstances like a
tsunami, or a 9-11 event. Europe and debt problems are on the back
burner for the time being.
November 2011 to February 2012!
Looking
over longer periods of time (like above chart since inception in
October 2009), portfolios look as though we were just
lucky enough to avoid downside. What we have yet to prove is how we can perform in a positive market. So let's review
the latest rally period since last November.
Did we really do something extraordinary? Our portfolios are the FAT Lines, gold, green, red and light blue.

Apart from taking a bold decision to accept our research as is, indicating another round of fairly steep ASSET INFLATION when
everyone else around us foresaw another 2008 in the making, we did only
the most basic and logical steps, still seeking confirmation by
additional technical analysis. Indeed, rather pragmatically we dollar-cost-averaged into the market some 3 times
and it so happened that the final step coincided with the time when the
markets really took off in an environment of favourably reduced
volatility. During that phase, the hi risk TREND model in gold outperformed the MSCI World as is the case during most bullish markets.
As
you can see, we are not rocket scientists, no need for quantum
physics, algorithmic genius, or metaphysical models. And yet, we
outperformed even exalted hedge funds of MAN, PAULSEN and SALUS ALPHA by a respectable margin.
We Think There Are More Such Chances Coming This Year. So why not sign up to one of our portfolio services?
Disclaimer:
Please
note, the model portfolio graphs here do not reflect charges on the
portfolios, such as initial charges on purchase and ongoing management
fees (WRAP fee). It also ignores any platform and other auxiliary costs
that may be incurred. As a rough guideline to the impact of costs,
please deduct about 2% per year from the annual return. Actual portfolios may be switched on varying dates, and - usually require more days for switch to be finalised than a virtual model. That influences actual charts but brings little disadvantages in real terms.
-.-
latest update: September 22, 2011
 |
| Model Portfolios since inception in October 2009 to September 22nd, 2011 |
The fat lines are our portfolios, the narrow lines are benchmarks and indices.
PortA, PortB, PortC and PortD are actively managed; PortE is semiactively managed, i.e. every 3-6 months or on a larger, longer term change in trend.
Our Portfolios values are now some 20-25% ABOVE global and Asian market indices and benchmark funds, when viewed since inception, almost exactly 2 years ago.
Switches since inception:
We have made a few more switches since May, the last update (last transactions on top):
17. September 5th, 2011, exiting all equity including gold futures
16. August 24th, 2011, partially rebuilding equity positions (about 30-45% according to risk profile
15. August 5th, 2011, exiting all equity except gold futures fund

We switch almost all portfolios at the same time, regardless of investor risk. As a result, the top two risk portfolios perform rather similar in the short term and their differences will become apparent only after a longer period.
The earlier weeks of 2011 proved to be a considerably challenge for us: the funds - and the underlying asset classes - underperformed many markets, punishing a more conservative approach we used, while topical trends suffered profit taking by foreign investors (investment outflow from emerging markets into developed markets, - and gold). We switched to absolute safety on February 7th, 2011.
Only in the third week of February did we take the decision to reengage in higher equity allocation. That was despite concern over the Arab Spring and the worry over spiralling energy prices. It was a brave decision that was only briefly tested during the Japan disaster mid-March. Immediately following, portfolios had a phenomenal rally and we switched to safety in early April 2011.
 |
| model portfolios YTD |
OUR MODELS
As for the models: A-E are assuming that investment is made via "CASH".
- PortA (BLUE LINE)- a low to medium portfolio, targeting 7% per annum; benchmark - other global balanced funds
- PortB (DARK RED LINE)- a balanced portfolio targeting 9% per annum , benchmark - other growth oriented actively managed funds
- PortC (GREEN LINE)- a growth driven portfolio targeting 12-16% per annum, with global equity as a benchmark.
- PortD (GOLDEN LINE) - a trend driven portfolio, targeting +20% per annum, and the same benchmark as C.
- PortE (PURPLE LINE) - a growth driven, semi-actively managed portfolio for those investors who seek gradual growth via a diverse asset allocation. Target growth +14% per annum. This is a NEW ADDITION, which we initiated in January 2011.
Model portfolios are virtual portfolios ONLY RELEVANT TO PORTFOLIOS TILL 2012, TERMED: "THE OLD MODEL PORTFOLIOS":
- They do not take account of any initial setting up cost, ongoing wrap fees and other miscellaneous cost portfolios incurred over time.
- Model portfolios may contain less funds than actual - larger- portfolios in excess of SGD1,000,000).
- Switching out is done on line with actual transactions in real portfolios, i.e. if we propose a switch for today for client portfolios the model portfolio will replicate that. Switching IN, i.e. the second leg, is done on the following day. This means that the model portfolio has a potential advantage in that the timings of the first and second leg of the switch are closer together. But over longer periods, this apparent advantage is negligible as there will be occasions when the shorter switching process turns out to be a handicap (switching in too early!).
When observing model portfolios - and making comparison with your own - please ensure you are comparing in the same time frames.
What we hope to highlight here is the simple fact that our investment process WORKS in even in this simplified fund of funds portfolio, beating global and Asian market indices and benchmark funds by a notable margin, even over short periods.
Want to know more? Just leave a comment!

Comments