The Patriotic Rally Notion
“World equities have peaked!”
In the terrible aftermath of the Paris bombing, I read some commentators referring to the rally since last Monday as a "Patriots' Rally". I am not sure whether this term really is in use, and I can't quite imagine a Patriots' Rally to go round the world! Could someone really be considering a stock market rally as a viable battle strategy against DAESH / Islamic State? And why does the media still indulge the black flag guys by honouring the name they have given themselves? DAESH denotes who they are.
Be that as it may, since that dreadful Friday, global equity markets have been rallying as has the USD. But a continuation beyond today is hard to visualise when you look at the odds stacked against it.
Based on SGD, this portfolio returned 0.87% from November 6 to November 27, while I could sit back and watch the markets gyrate.
Now I want to check whether that was a worthwhile call. The following comments refer to the period between November 5th and 27th. For the purpose of illustrating an analysis of the price structures in a suitable time frame, the daily charts cover the time from October to end of November.
Firstly, US equity:
The DJIA
 The first move was indeed down, erasing some 4.5%. Since then it has recovered 3.5%. Switching out meant not losing the 1% difference. That is OK for a balanced and conservative investor, but the higher risk investor may feel indignant.
However, the momentum of recovery bounce is not confirmed by the RSI. This suggests that the advance is “false” and the market should turn down again, very soon, if not already today, Monday, 30th November. Indeed the weakness in the RSI points to a substantial drop over the coming two weeks, below the November low.
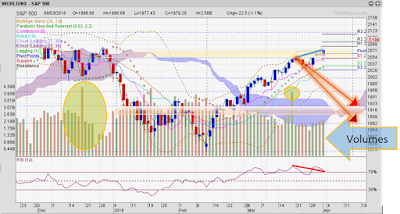
The S&P 500

The NASDAQ 100
The
initial losses amounted to 5.4%, and the rebound recovered 4.6%. Here,
too, we observe a divergent RSI.
The US Dollar
Secondly, European
equities:
The German DAX
The FTSE 100 - UK
EuroSTOXX 50

Now I want to check whether that was a worthwhile call. The following comments refer to the period between November 5th and 27th. For the purpose of illustrating an analysis of the price structures in a suitable time frame, the daily charts cover the time from October to end of November.
Firstly, US equity:
The DJIA

However, the momentum of recovery bounce is not confirmed by the RSI. This suggests that the advance is “false” and the market should turn down again, very soon, if not already today, Monday, 30th November. Indeed the weakness in the RSI points to a substantial drop over the coming two weeks, below the November low.
The S&P 500

The initial losses of 4.7% till
mid-November were similar to the DJIA, but the rebound looks lacklustre by
comparison. Here too, the RSI does not confirm the rise of the last few days and
with the turning point at hand, the index may suffer a similar fate as the
DJIA. At best I expect both indices ending the year a few points below the
current levels.
The NASDAQ 100
 |
| NASDAQ daily chart - Nov 2015, source Chartnexus |
 |
| NASDAQ 100 weekly chart - 2 years, source Chartnexus |
The weekly chart, however, highlights the extent of the
divergence: The RSI is indicating a reduction in the momentum since September 2014, the longest lasting divergence since the bull run started in March 2009. Even the V-shaped corrective move this August, which formed the sharpest correction - and recovery - in 4 years, could not effect a pattern change in the weekly RSI. It continues to point down. At some point soon, such a longstanding, strong divergence between the
index and its RSI will result in a more drastic correction, no matter how
impossible it appears to be, today.
The US Dollar
 |
| USD - Nov '15, rising, falling RSI and falling trading volumes |
To add some spice to the plot, the USD has risen 2% against a basket of
major currencies during the last 4 weeks. Foreign investors, investing in
US equity, may have had small losses in the indices, but these were temper stronger dollar. Faced with the prospect of an interest rate rise next week, sentiments are unlikely to change quickly. However, with RSI pointing lower and not
supporting the last ascent of the dollar, I suspect that additional -probably dovish- comments by the FED regarding further rate increments next year, will take the
heat off the rise, resulting in a softer dollar toward the end of
December.
In Summary: for US equities, the last 4 weeks were marked by volatility, offset in part by a
rising dollar. But going forward, the signs are there for an elaborate, time
consuming consolidation.
Secondly, European
equities:
The path
of EU equity in relation to the EUR is almost exactly inverse to that of the US: Since mid-October,
the EUR/USD went from $1.15 to 1.06, representing a loss of 7.8% for USD
investors. In November, the losses were less than 2%, but European indices
overall advanced after the first two weeks in November, ending the month on a
high.
The German DAX
 |
| DAX - peak imminent? Expected lower by end of December |
With the
RSI rising since mid-November, the short-term index rally is supported, but prices are hitting a resistance level (see Fibonacci lines), which, with the likely change in momentum, will be difficult to overcome. Going forward, -
and for the rest of December, I don’t expect much more than a volatile sideways market.
The FTSE 100 - UK
 |
| FTSE 100 UK, 2 possible pathways, similar outcome; source Chartnexus |
The
British Pound Sterling moved distinctly different in relation to the USD. It
stayed in range between 1.53 and 1.52, a swing of less than 1%. Consequently,
the FTSE saw notably higher volatility with an interim loss of 6.2%
mid-November, recovering 5.2%. However, a rising RSI supports the
bullish momentum. Still, in perfect correlation to the rest of EU equity, the
FTSE should trade within a smaller range till the end of the year, i.e. trading
sideways.
EuroSTOXX 50

EuroSTOXX 50 was range-bound, only mildly upturning at the end of
November. The RSI also hints at more sideways action in the near future. With
the losses in the EUR, this index only shows profits if you are a EUR investor.
In summary: for EU equity, all signs
point toward an increasingly volatile sideways market in December. The only
upside may be had as a consequence of a rebounding EUR.
Conclusion:
Moving to safety had clear advantages. The full force of a bearish environment has yet to impact. What we are experiencing are the first rumblings. High spirited investors may scoff at the strategy to run for safety in such a market, but the risk conscious operator will breathe a sigh of relief. A monthly gain of around 1%, only investing in bonds and cash, and sleeping well, works wonders on jittery nerves.
Just how beneficial the advice was for Asian markets, I will highlight in the next post, which will be ready by Wednesday.
Wishing you safe, profitable investing.


Comments